US stocks hit an all-time high for the 23rd time this year. Is it a good time to buy?
A detailed analysis of buying the S&P 500 at all-time highs including inflation-adjusted performance
“The stock market is a device for transferring money from the impatient to the patient.” - Warren Buffett
Probably you have already seen this quote somewhere throughout your journey. It is one of the most important sentences that have ever been said concerning investing. And this is the core of today’s analysis. Namely, every time when you see some mentions of historical losses, remind yourself of this quote as it will supplement subsequent conclusions.
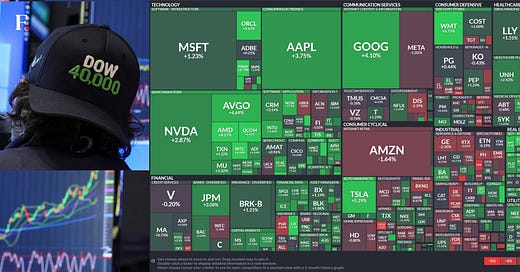
On Friday, the S&P 500 finished the week above 5,300 points for the first time ever and is just ~15 points from its all-time closing high. Moreover, the Dow Jones Industrial Average closed above 40,000 points for the first time in history. At the same time, the VIX volatility index dropped below 12 points, the lowest daily close since November 2019.
Across different S&P 500 sectors, semiconductors have seen the most gains with AMD advancing by 8% this week. The full weekly heat map of the index can be seen below:
Stock gains have been driven by the weakening US economic data, buybacks and decent Q1 earnings season. Yes - the deteriorating US economy has been fueling the stock market rally. This is because investors and traders hope the Fed will cut rates earlier. The market is currently pricing 2 rate reductions in 2024, up from 1 at the beginning of May. Potential rate cuts are bullish for stocks as they may provide a lower cost of borrowing for corporate investment and eventually higher earnings. They are bullish unless the Fed does not cut rates to fight an economic downturn at the end of a business cycle.
As of now, official data does not show significant issues in the US economy despite many cracks under the surface. For example, there is a lot of US labor market data showing that the reality looks completely different than 40 months of job gains reported in the media headlines. Full analysis under the link:
We have to remember, however, that in the first place, the market is moving based on the data provided by the financial media headlines. This also has seen some cracks.
Indeed, the US economic surprise index has plummeted to the lowest level since January 2023. The economic surprise index measures whether US economic data has been coming in above or below average Wall Street estimates.
The current reading underlies that most of the data has recently surprised downward as shown in the below chart.
When the economic data comes below projections it triggers higher expectations of rate cuts and in effect bond yields move lower while stock prices higher.
Now, as we are aware of the reasons behind the US stock indices’ all-time highs let’s think about what’s next. One could think that the train has already left the station, it is too late to invest and will wait for a dip. However, what if a dip will not come in weeks and months? Moreover, what if someone would like to invest regularly ignoring whether the stock market is at all-time highs or not but still caring about the returns? What to do then when stocks are trading at all-time highs?
The following section will examine whether investing in all-time highs can provide more than average gains and make sense. It also digs into the historical performance over the last century and compares nominal to inflation-adjusted gains with a brief look at bull and bear markets including corrections.
This analysis is key for medium and long-term stock market investors as it dispels doubts and common misconceptions about stock market investing.
IS IT WISE TO BUY STOCKS AT ALL-TIME HIGHS?


