How to construct an investment portfolio in different inflation regimes
Stocks perform best in periods of falling and stable inflation while commodities and precious metals in periods of rising inflation
Inflation is still a pretty hot topic among investors, economists, and analysts as it has been the main driver of the central banks’ decisions in the last couple of years. Taking the example of the Federal Reserve, the US institution’s mandates are to keep stable prices over the long term (implicit 2% inflation target) and to achieve maximum employment. In order to adhere to these mandates the central bank moves its interest rates up or down when the economy is growing too fast or slowing down as well as changes the size of its balance sheet by buying or getting rid of government bonds (in the secondary market) and other financial instruments. In other words, it tries to control the money supply. Changes in both the inflation and money supply significantly impact asset prices. In most cases, the latter influences the former. By knowing this we can have a look at how major asset classes perform in different inflation regimes and what could be an optimal asset selection in an investment portfolio during rising, falling, and stable inflation periods.
INFLATION REGIMES AND ASSET PERFORMANCE
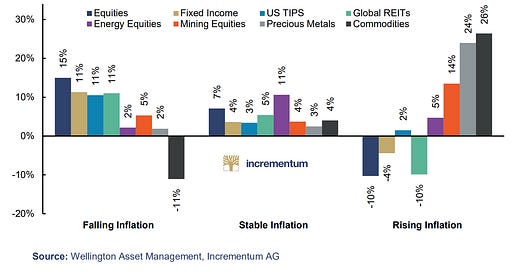
There have been many analyses and exercises on major asset performance in different inflation periods. Most of them have had similar outcomes. One of the most clear and concise has been done by Incrementum AG within the In Gold We Trust annual report, an excerpt is attached below.
The key takeaways from this analysis are:
Stocks (Equities) but not necessarily energy or mining sectors perform best during periods of falling inflation followed by bonds (Fixed Income), Treasury Inflation-Protected Securities (US TIPS), and real estate (Global REITs - Real Estate Investment Trusts) while commodities are the worst performers.
Stocks, especially the energy sector provide the highest return during periods of stable inflation with the rest of the assets performing below average but still providing some below-average gains.
In periods of rising inflation commodities have had the largest returns in the past along with precious metals followed by mining stocks. The worst performers in this case have been stocks in general, real estate, and bonds.
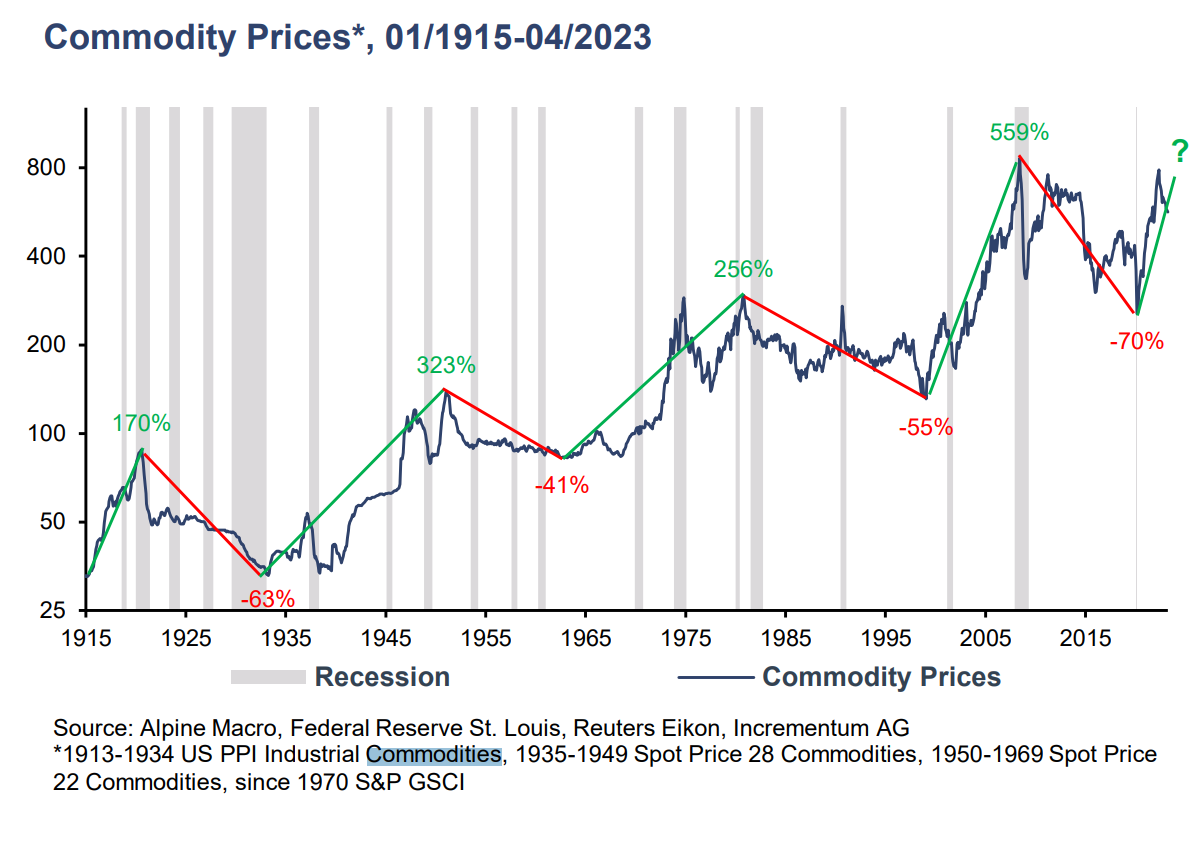
It is worth adding that it is a historical performance and does not guarantee future results. However, some interesting patterns there indeed make a lot of sense such as commodities rising during inflationary periods, and can be exploited to construct a pretty convenient investment portfolio. In the next section, we will try to somewhat solve this conundrum using a practical approach, low-cost funds such as the most liquid Exchanged Traded Funds (ETFs) and Real Estate Investment Trusts (REITs). Though for precious metals I would prefer using physical gold and silver.
PORTFOLIO FOR FALLING INFLATION
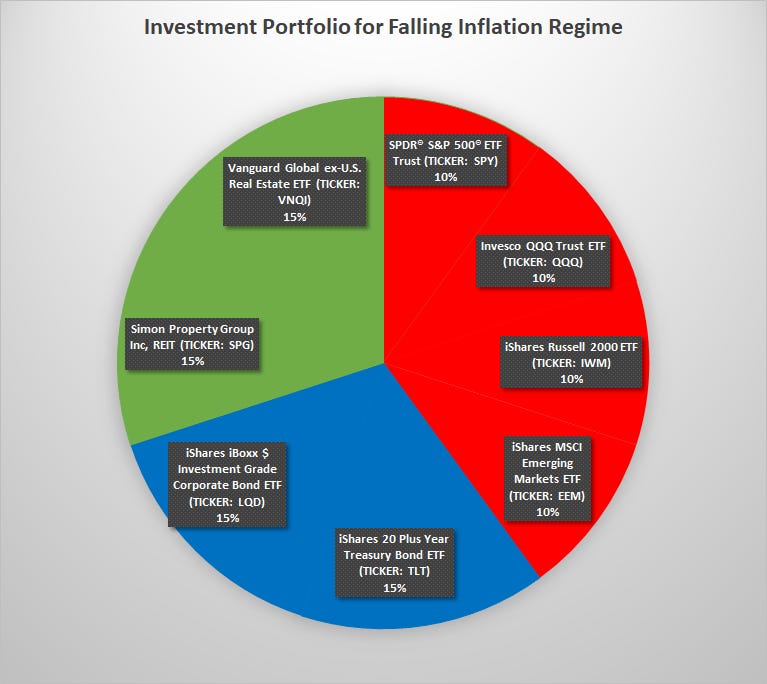
To construct a portfolio that performs well during the period of falling inflation we will use the most weight for stocks - 40% with the rest equally distributed between bonds - 30% and real estate - 30%. This is based on the first takeaway from the previous section. Moreover, to provide more diversification stocks will be divided into four different ETFs giving an exposure to the S&P 500 (large capitalization stocks), Nasdaq 100 (technology stocks), Russell 2000 (small capitalization stocks), and emerging market stocks. For bonds, we will use 20+ year US Treasury Bonds ETF as well as investment grade corporate bonds (the safest kind of corporate debt). Finally, for real estate, we will use Simon Property Group REIT, one of the five largest in the US giving an exposure for shopping centers & restaurant properties in the United States. This REIT also pays a more than 5% dividend yield. To have some real estate assets outside the US, the portfolio will also consist of the Vanguard Global ex-U.S. Real Estate ETF which invests in stocks in the S&P Global ex-U.S. Property Index, representing real estate stocks in more than 30 countries.
This is a summary of the entire portfolio:
Stocks (40%):
SPDR® S&P 500® ETF Trust (TICKER: SPY), 10%
Invesco QQQ Trust ETF (TICKER: QQQ), 10%
iShares Russell 2000 ETF (TICKER: IWM), 10%
iShares MSCI Emerging Markets ETF (TICKER: EEM), 10%
Bonds (30%):
iShares 20 Plus Year Treasury Bond ETF (TICKER: TLT), 15%
iShares iBoxx $ Investment Grade Corporate Bond ETF (TICKER: LQD), 15%
Real Estate (30%):
Simon Property Group Inc, REIT (TICKER: SPG), 15%
Vanguard Global ex-U.S. Real Estate ETF (TICKER: VNQI), 15%
PORTFOLIO FOR STABLE INFLATION
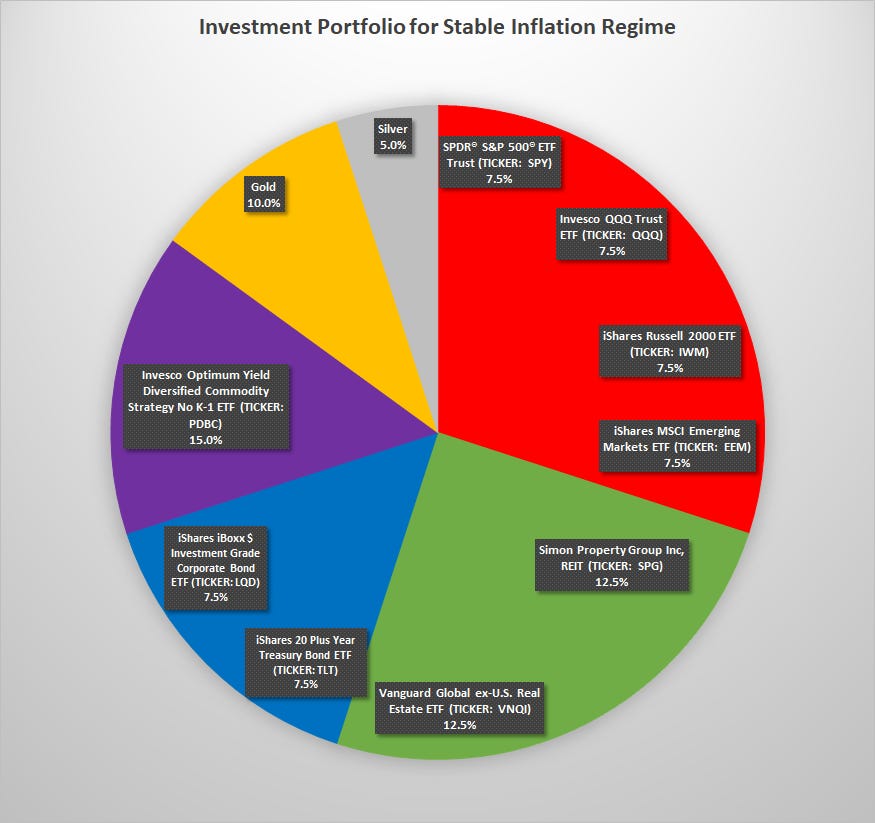
In case of a stable inflation environment, the most weight again will be put into stocks - 30% followed by real estate - 25%, bonds - 15%, and commodities - 15% (Invesco Optimum Yield Diversified Commodity Strategy No K-1 ETF), and precious metals - 15% (gold - 10% and silver - 5%, as silver is a more volatile and riskier asset).
This is a summary of the entire portfolio:
Stocks (30%):
SPDR® S&P 500® ETF Trust (TICKER: SPY), 7.5%
Invesco QQQ Trust ETF (TICKER: QQQ), 7.5%
iShares Russell 2000 ETF (TICKER: IWM), 7.5%
iShares MSCI Emerging Markets ETF (TICKER: EEM), 7.5%
Real Estate (25%):
Simon Property Group Inc, REIT (TICKER: SPG), 12.5%
Vanguard Global ex-U.S. Real Estate ETF (TICKER: VNQI), 12.5%
Bonds (15%):
iShares 20 Plus Year Treasury Bond ETF (TICKER: TLT), 7.5%
iShares iBoxx $ Investment Grade Corporate Bond ETF (TICKER: LQD), 7.5%
Commodities (15%):
Invesco Optimum Yield Diversified Commodity Strategy No K-1 ETF (TICKER: PDBC), 15%
Precious metals (15%):
Gold, 10%
Silver, 5%
PORTFOLIO FOR RISING INFLATION
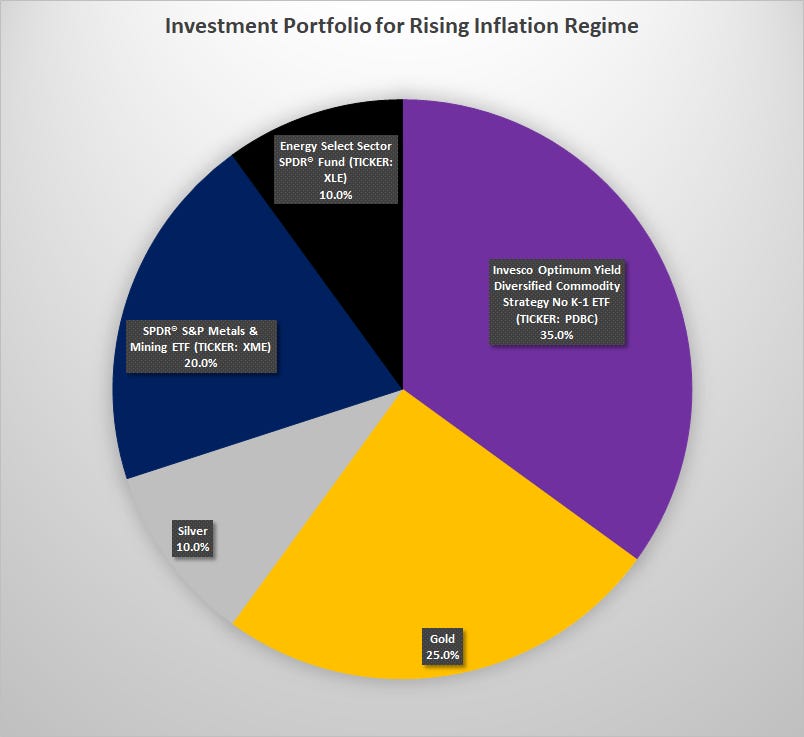
For a scenario of rising inflation, commodities and precious metals usually lead the way and will have here the most weight of around 35% each with 20% going to the mining stocks (SPDR® S&P Metals & Mining ETF) and 10% to the energy stocks (Energy Select Sector SPDR® Fund).
This is a summary of the entire portfolio:
Commodities (35%):
Invesco Optimum Yield Diversified Commodity Strategy No K-1 ETF (TICKER: PDBC), 35%
Precious metals (35%):
Gold, 25%
Silver, 10%
Mining Stocks (20%):
SPDR® S&P Metals & Mining ETF (TICKER: XME), 20%
Energy Stocks (10%):
Energy Select Sector SPDR® Fund (TICKER: XLE), 10%
It is important to note that commodities are very risky assets to hold, and may stay low even for decades. Therefore, not too much weight should be used in this class unless we have a very high conviction of an upcoming inflation.
SUMMARY
As you can see, portfolio construction for different inflation periods is not difficult. The real dilemma here is whether inflation will be stable, fall, or rise in the upcoming months and years. At this moment, the most likely scenario is that it will remain steady or will fall slightly more after some rapid deceleration in the past several months. However, there are some indications and warning signs of an upcoming inflation rebound given how much stimulus has been provided by the US government (deficit) which helped the economy to stay resilient in official data along with the Fed’s pivot in December promising three rate cuts this year - causing financial conditions (measures the relative availability and cost of credit as evidenced by financial stress in the fixed-income, money, and equity markets) to ease the most in two years. In other words, the availability and cost of credit are the most favorable in two years.
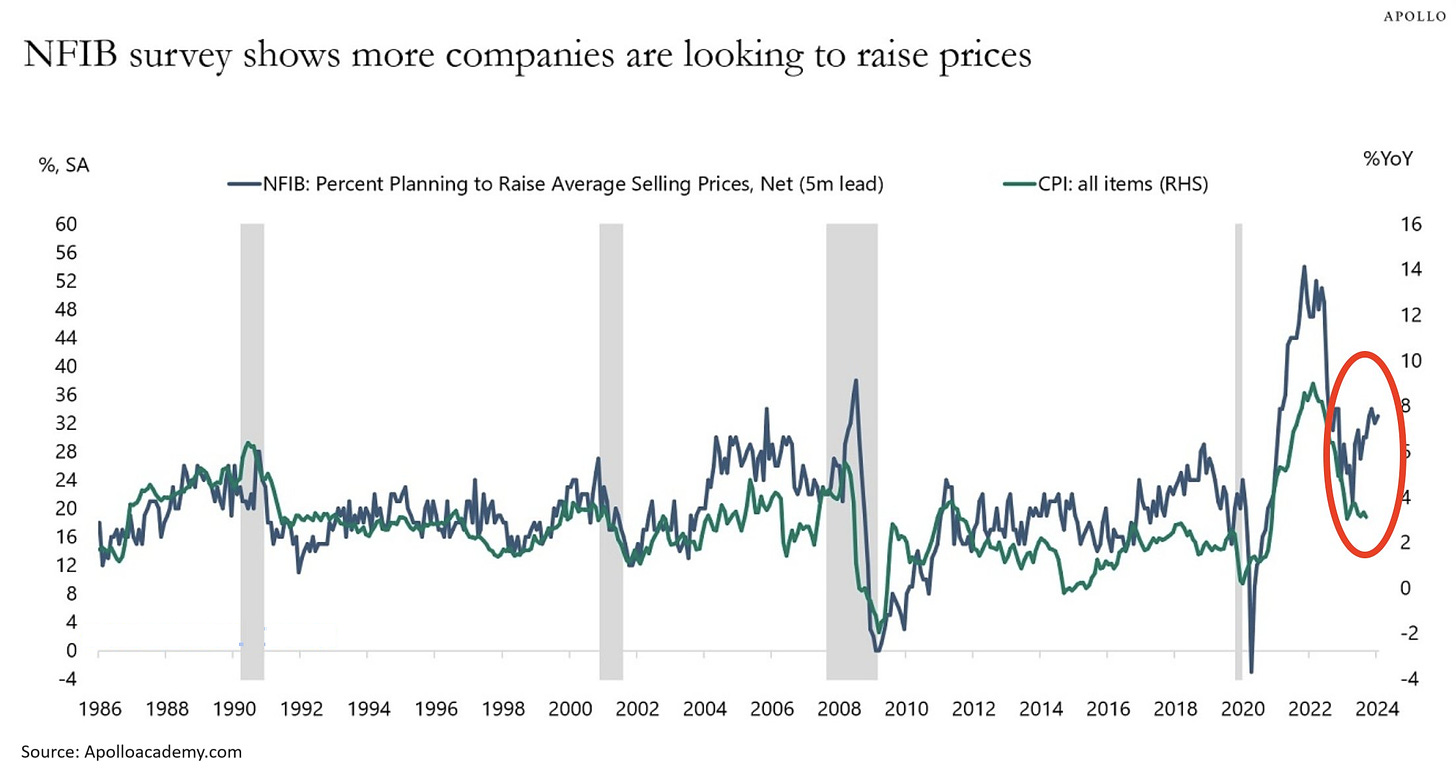
The below chart shows the percentage of companies planning to raise average selling prices in the US over the next 3 months (the NFIB survey asks 10,000 firms). Over the last 3 months, the number of companies responding "yes" has jumped from roughly 20% to more than 30%. As you can see, this survey is highly correlated with US CPI inflation data.
This is a pretty interesting forward-looking indicator that leads the inflation metric by 5 months. Even if the gap doesn’t close, the US economy may see a 4-5% inflation again this year. It is worth keeping an eye on further developments of this data.
If you find it informative and helpful you may consider buying me a coffee and follow me on Twitter:

