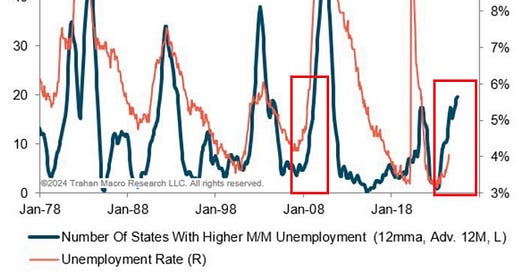
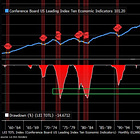
CHART OF THE WEEK: The number of states with rising unemployment jumped to the highest since the Great Financial Crisis
This metric usually leads the US unemployment rate by roughly 12 months
Before you proceed, please find below the link to a 10% discount for a premium content annual subscription:
The number of states with rising month-over-month unemployment soared to the highest level since 2009, according to Trahan Macro Research.
More, specifically, the 12-month moving average of states with higher unemployment recently hit 20 and has been sharply rising.
In the past economic cycles, each time when such a high number of states experienced soaring unemployment the US jobless rate spike followed. The graph above shows that the number of states leads the unemployment rate by roughly 12 months.
In other words, in the next several months the jobless rate could increase to at least 5.5% if the relation holds. This is another leading indicator pointing to a mild recession in the world’s largest economy.
On Friday, even the Fed Chair Jerome Powell admitted that the labor market is weakening saying“We do not seek or welcome further cooling in labor market conditions.” among other things. More on that event in the next Weekly Market Recap.
To read further about the US economic data and how to invest in such a climate please read the following articles:
If you find it informative and helpful you may consider a paid subscription (or annual if subscribed), become a Founding Member, and follow me on Twitter:
Why subscribe?

